In-World Visualization

In-World Visualization means that everything is shown inside Station A01. There are no external views, no direct desktops and no out-of-world interfaces. If something is visible, it exists as part of the station.

What In-World Visualization Means

In-World Visualization ensures that all information is embedded directly into the environment.
In-world displays integrated naturally into the station architecture.
Nothing is shown outside the station context.
If a system exists, it is represented as an object, screen or behavior inside the world.

No External Views

The stream never cuts to real desktops, editors or control panels.
Station interior without any external overlays or UI elements.
Real development tools exist — but they are only visible through in-world displays.
This preserves the integrity of the station perspective at all times.

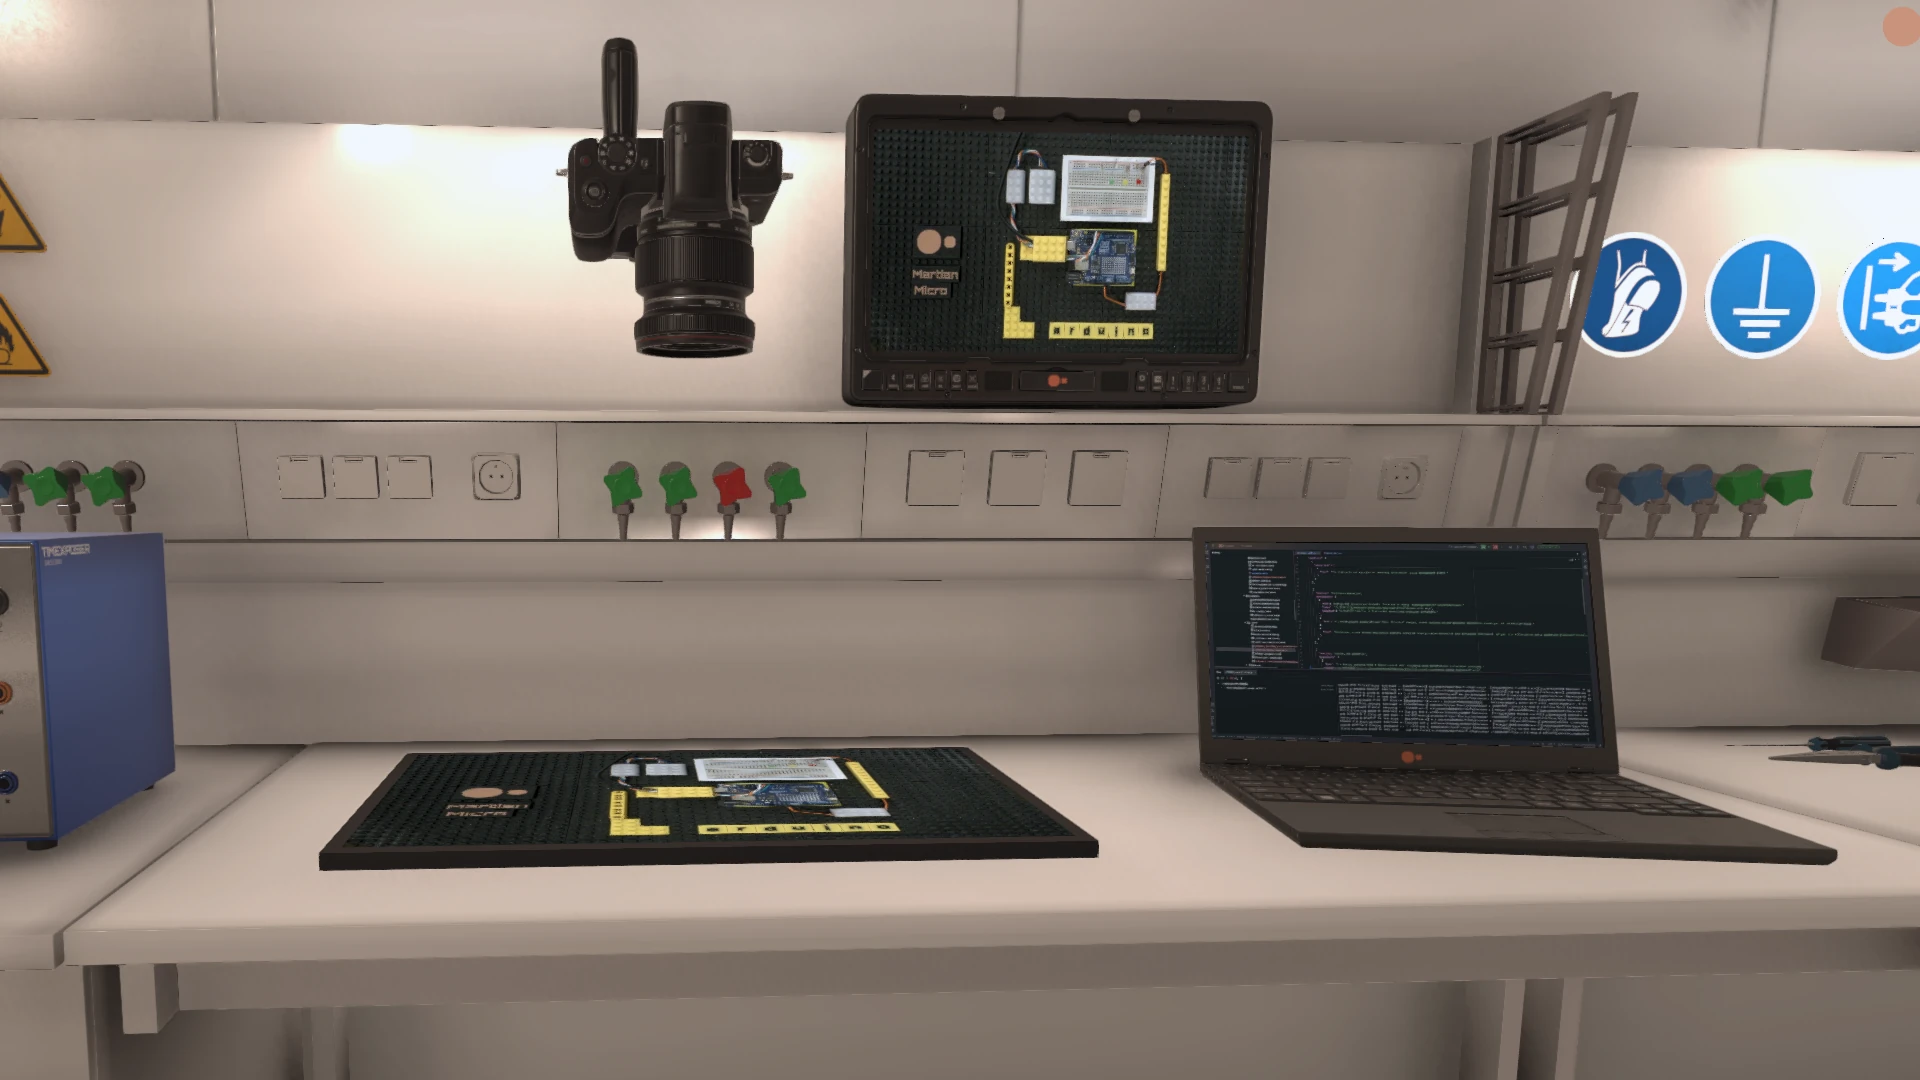
Screens as Interfaces

Screens are the primary interface between systems and the world.
Multiple in-world screens showing different system states.
They display live camera feeds, logs, diagnostics, development tools and system status.
Screens are treated as physical objects with location, orientation and context.

Visualizing Abstract Systems

Abstract processes are visualized spatially.
Abstract data represented as spatial or visual elements inside the station.
Data flow, system state and activity are translated into visual structures.
This allows complex systems to be perceived without explanation.

Real and Virtual in One Space

In-World Visualization bridges real and virtual systems.
Real-world system activity mirrored inside the station environment.
Real devices influence visual elements inside the world.
Virtual controls can trigger real-world reactions.

Visualization as Orientation

Visualization is primarily used for orientation, not explanation.
Clear, readable visual layout inside the station.
Colors, movement and placement indicate relevance and activity.
Viewers can understand the state of the station at a glance.

Persistence of Visual Elements

Visual elements persist across streams.
Station view showing consistent elements over time.
Screens, panels and indicators remain where they are.
As systems evolve, their visual representations evolve with them.

Relation to Other Systems

In-World Visualization relies on multiple underlying systems.
Live data and interaction are provided via FeatureCloud.
Interfaces are rendered through MetaPhone and embedded into the station environment.

For the Viewer

For viewers, In-World Visualization creates coherence.
Calm station view where all information feels naturally embedded.
There is no need to mentally switch between worlds.
Everything you see belongs where it is shown.